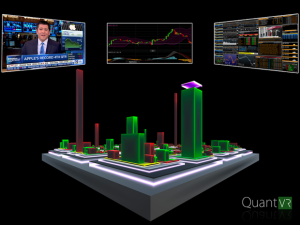
QuantVR wants to turn stock market data into immersive virtual reality experiences
 ...the high percentage (70%) of trades that are done with algorithms, and they occur in a fraction of a second.
"3D graphs that represent stock price over a day or over a few hours, they fundamentally fail in their ability to represent what's actually happening in the market," he said.
The idea behind Visual Order Book is to allow for representation of those split second timescales. "It's really the first time that you can actually see the stock market from the point of view of an algorithm," he said
There's also Stockscape. It does two things: Lets users set up multiple screens, and also creates a large, navigable graphic that looks like a city where the 2,000 most highly-traded stocks on the US exchanges are divided by industry sector, subdivided into industry groups, and further subdivided into high performing, mutually performing, and poorly performing stocks. The height of individual stock blocks represent different metrics like market cap, volatility, and price.
Alpha Canvas allows users to enter a trading strategy in the form of a graphical element. Greenbaum said that for traders who want to design an algorithm, but don't know how to code, they can draw a filter that will function like an algorithm.
See the full story here: http://www.techrepublic.com/article/quantvr-wants-to-turn-stock-market-data-into-immersive-virtual-reality-experiences/
Pages
- About Philip Lelyveld
- Mark and Addie Lelyveld Biographies
- Presentations and articles
- Tufts Alumni Bio